llvm-locstats - 計算 DWARF 除錯位置的統計資訊
概要
llvm-locstats [options] [filename]
描述
llvm-locstats 的運作方式類似於 llvm-dwarfdump 的包裝器。它解析 llvm-dwarfdump 關於除錯位置的統計資訊,並以更易於人類閱讀的方式美化列印。
0% 行顯示沒有位置資訊的 DIE 數量和百分比,而 100% 行顯示所有程式碼區段位元組(變數或參數在作用域內)都具有位置資訊的 DIE 資訊。[50%,60%) 行顯示位置資訊涵蓋其作用域 50% 到 60% 的 DIE 數量和百分比。
選項
- --only-variables
僅針對區域變數計算位置統計資訊
- --only-formal-parameters
僅針對形式參數計算位置統計資訊
- --ignore-debug-entry-values
忽略包含除錯進入值 DWARF 運算的位置統計資訊
- --draw-plot
製作產生的位置 bucket 的直方圖(需要 matplotlib)
- --compare
比較提供的兩個檔案的除錯位置覆蓋率,並繪製圖表顯示差異(需要 matplotlib)
結束狀態
llvm-locstats 如果成功解析輸入檔案則返回 0。否則,返回 1。
範例 1
在標準輸出上美化列印位置覆蓋率。
llvm-locstats a.out

  =================================================
            Debug Location Statistics
  =================================================
        cov%          samples       percentage(~)
  -------------------------------------------------
     0%                    1              16%
     (0%,10%)              0               0%
     [10%,20%)             0               0%
     [20%,30%)             0               0%
     [30%,40%)             0               0%
     [40%,50%)             0               0%
     [50%,60%)             1              16%
     [60%,70%)             0               0%
     [70%,80%)             0               0%
     [80%,90%)             1              16%
     [90%,100%)            0               0%
     100%                  3              50%
  =================================================
  -the number of debug variables processed: 6
  -PC ranges covered: 81%
  -------------------------------------------------
  -total availability: 83%
  =================================================
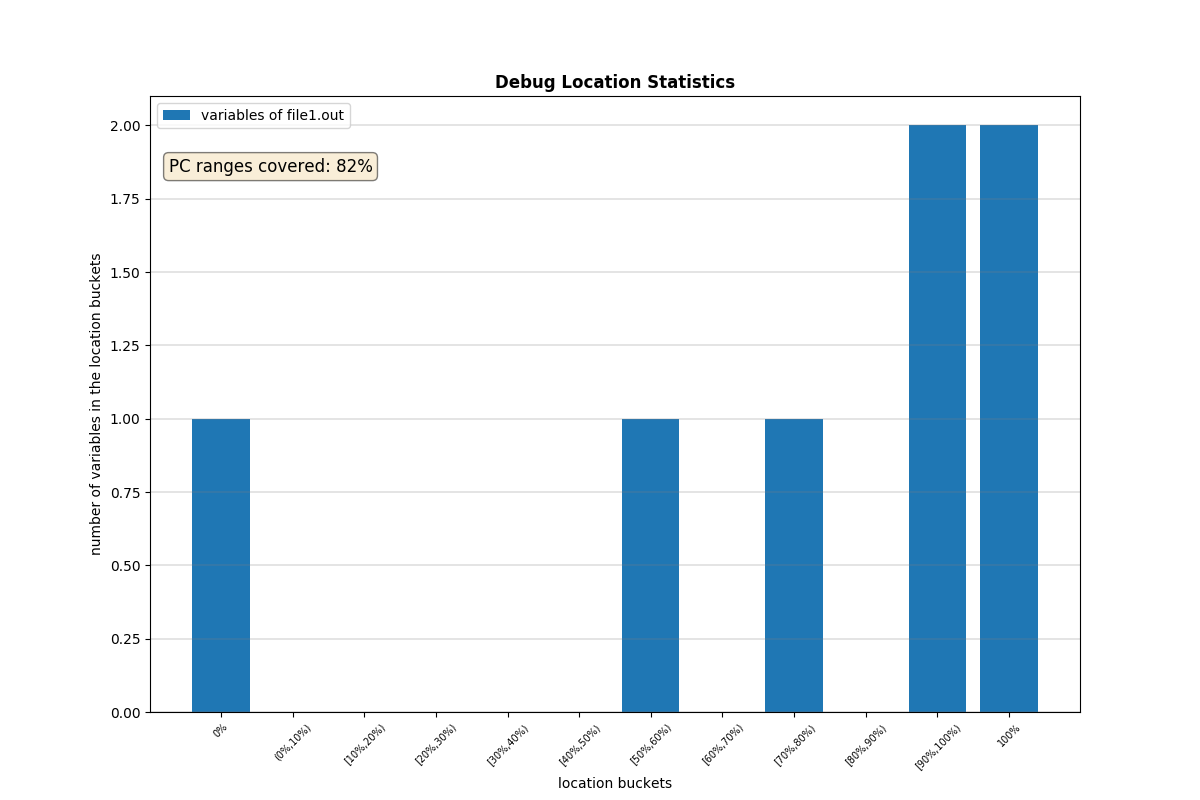
範例 2
產生圖表作為影像檔案。
llvm-locstats --draw-plot file1.out
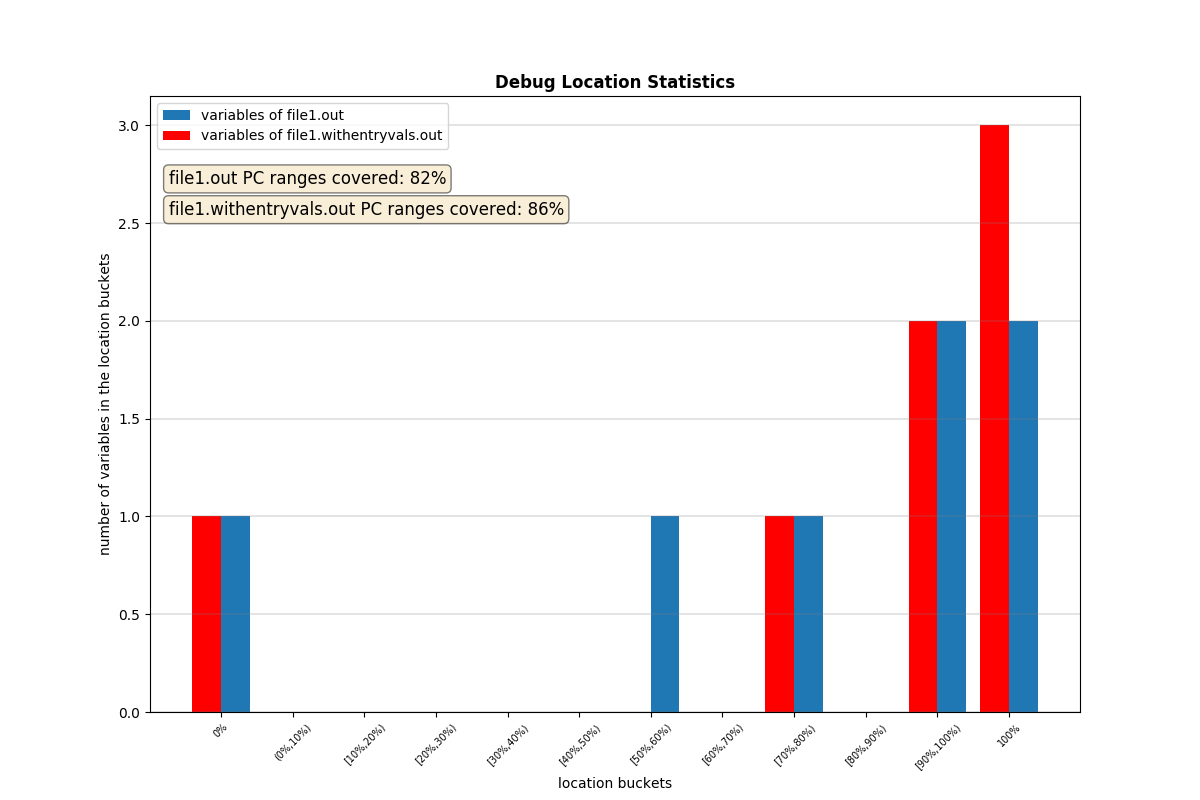
範例 3
產生圖表作為影像檔案,顯示除錯位置覆蓋率的差異。
llvm-locstats --compare file1.out file1.withentryvals.out